Dotlet Help

This page explains how to use the dotlet program. For a quick summary of dotlet's less obvious commands, see the command summary page. There is also an examples page that shows you the kind of features that can be discovered with this program.
Since this program runs on many platforms, your screen may be a bit different from the screenshots shown below (which implements the Java look-and-feel). Don't worry, the program works in the same way everywhere (well, at least it should :-).

The basic procedure

First of all, here's a presentation of dotlet's menu bar:

Figure 1: The dotlet menu bar
fig1

The basic procedure has the following steps:
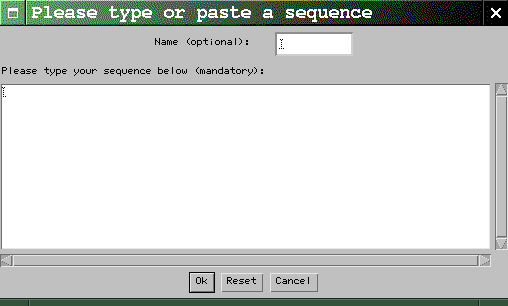
  1. Click on the Input button. This opens the Sequence Input Dialog:

    Figure 2: The Sequence Input Dialog
    fig2

    Now type or paste a sequence in the dialog's main text area. You can give your sequence a name if you wish (use the Name textfield for this); if you don't, dotlet will create one for you. When you're done, click the Ok button. Characters other than letters are ignored, so it is ok to cut-and-paste a sequence that has spaces or position numbers in it. Case is not important.
    Once the sequence has been input, there is no way to modify it. If you need to enter a second sequence, repeat this step. Notice how the sequence menus reflect the name(s) of the sequence(s) you entered, or the automatically attributed name(s) if you didn't name your sequence(s).

  2. Select the horizontal sequence from the first sequence menu, and the vertical sequence (which can be the same as the horizontal one) from the second sequence menu. If you want to use another matrix than the default, you may do so from the matrices menu. The program automatically determines if a sequence is protein or nucleic acid, and offers a choice of adequate matrices. Similarly, you can select a zoom factor and the sliding window's size from the corresponding menus.

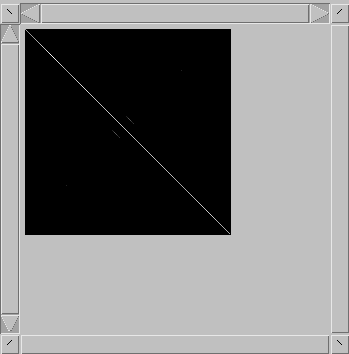
  3. Click the Compute button. After a while (this depends on the speed and load of your computer, as well as on the lengths of the sequences), the dots window will display the diagonal plot. It looks like this:

    Figure 3: The Dots window, with no grayscale adjustments
    fig3

    Each pixel corresponds to a residue in the horizontal sequence, and another residue in the vertical sequence. The pixel's color depends on how similar the two sequences are around these two positions: each pixel represents a score, with high scores meaning good matches (in this case, the darker the pixel, the lower the score). Obviously there will be a large number of pixels with low scores and only a few ones with high scores. It is likely that you will have to tune the grayscale in order to make the background noise (low scores) disappear and the similar regions stand out more clearly (the image shown in Fig. 3 has quite a bit of background). To do this, use the histogram window (Fig. 4):

    Figure 4: The Histogram window, unadjusted
    fig4
    Figure 5: The Histogram window, after adjusting the grayscale
    fig5

    This represents the frequency of each score, over all the pixels, on linear (blue) and logarithmic (purple) scales; with the lowest possible score on the left and the highest on the right. The large peak on the left corresponds to the majority of pixels with low scores. If the sequences have some similarity (as is the case here), there will also be a smaller peak of higher scores. Sometimes the proportion of high-scoring pixels to the noise will be so low that the peak will be barely, if at all, perceptible on the linear scale. Hence the use of the semi-logarithmic plot.
    With the scrollbars below and above the histogram, respectively, bring the lower threshold just past the first peak, and the higher threshold just past the second peak (Fig. 5).
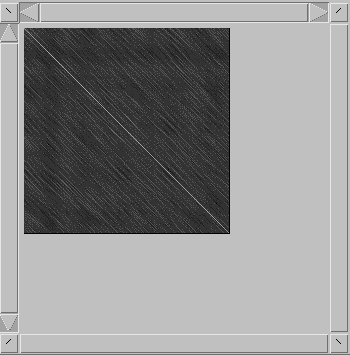
    Now, the background noise has disappeared from the dots window, and the similar regions stand out more clearly (Fig. 6):

    Figure 6: The Dots window, after adjusting the grayscale
    fig6
That's it.
If your sequences are too long for the dot window, you have two options. First, you can choose a smaller zoom factor (use the zoom factor menu). You'll have to start the computation anew. Alternatively, you can move around the dot window by using its vertical and horizontal scrollbars. At the corners of the zoom window are four buttons, with which you can slide the display diagonally.

If you wish to inspect the alignment at some spot, click on the corresponding pixel in the dot window. A cursor (blue cross) will appear, and the alignment window will display the sequences around the cursor's positions (Fig. 7).

Figure 7: The Alignments window
fig7

Residues that match well (according to the matrix) are colored in blue. The comparison window is highlighted by a purple box. The cursor can be dragged around (if you try to drag it beyond the edges of the dot window, the whole display will scroll instead). The alignment window's scrollbars have the same function. The cursor can also be moved with the keyboard with the arrow keys, and with '<' (up left), '>' (down right), '[' (up right), and ']' (down left). When the display is zoomed, the cursor will not be updated at every keystroke, but the alignment window will.

Beyond the basics

When comparing nucleic acid to nucleic acid, in addition to comparing the sequences the usual way, dotlet will reverse complement one of the sequences and perform a second comparison. Each pixel is set to the best of these two scores. This enables to see structures like stem-loops, for example. The alignment window will also display the reverse complemented sequence.

It is also possible to compare a protein to a nucleic acid sequence (but not the reverse - yet). In this case the nucleic acid sequence is translated in the three forward frames, the comparison is performed for each frame, and the pixels are set to the highest of the three scores. The alignment window also displays the three translated frames. This is useful for finding frameshifts or exons (although the latter can be done by comparing gene and mRNA). See the examples page for more.
Marco Pagni
Thomas Junier
Last modified: Tue Jul 13, 1999