A picture can be more explicit than thousand words
| The Local Pairwise Alignment of Two Sequences |
Here below, the classical text representation of a pairwise alignment of two sequences (THIO_ECOLI and PDI_ASPNG). This alignment was obtained with the Smith-Waterman algorithm, a BLOSUM62 similarity matrix and (-11/-1) for gap opening and extension penalties, respectively.
37.5% identity in 80 aa overlap; score: 122

                   20        30        40        50              60
THIO_ECOLI SFDTDVLKADGAILVDFWAEWCGPCKMIAPILDEIADEYQ------GKLTVAKLNIDQNP
           :.   :.  :  .:..:.: ::: :: .::  ::.:  :       .:.:.::..   :
PDI_ASPNG  SYKDLVIDNDKDVLLEFYAPWCGHCKALAPKYDELAALYADHPDLAAKVTIAKIDATAND
           370       380       390       400       410       420

               70        80
THIO_ECOLI GTAPKYGIRGIPTLLLFKNG
              :   : :.::: :.  :
PDI_ASPNG  VPDP---ITGFPTLRLYPAG
           430          440
|
| An alternative graphical representation of the same local alignment is proposed in the figure below. |
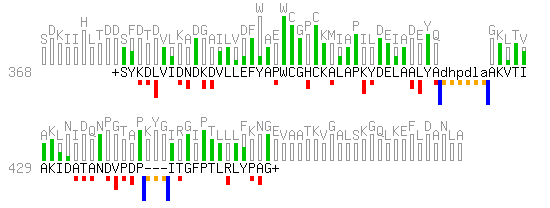
- The amino acids of the query sequence (THIO_ECOLI) are represented using the grayed residues at the top of the grayed background histogram. Hence the full length of the query sequence is shown.
- The local alignment of PDI_ASPNG on the query is represented by the sequence in black. The "+" signs at both ends of the aligned sub-sequence indicate that the alignment is local on PDI_ASPNG (the symbols "<" and ">" can be used to tag sequence extremities).
- The Smith-Waterman score (122) is proportional to the sum of the areas of the red, blue and orange rectangles. The areas of the rectangles located below the aligned sequence are negative.
- The area of every red rectangle corresponds to the score attributed by the similarity matrix to an observed pair of amino acids. The underlying gray rectangles represent the maximal score possible at every position of the query, which correspond to the diagonal elements of the similarity matrix in this example.
- Two gaps are present in this example. The first one is an insertion (relative to the query) and is represented with lowercase letters. The second one is a deletion (relative to the query) and is represented with "-".
- The cost of a gap is proportional to the sum of the areas of the adjacent blue and yellow rectangles. The area of the two blue rectangles represent the "gap existence" cost which is equally divided into an opening and a closing penalty. The orange rectangles represent the costs for extending the gap.
|
| Alignment of a Sequence on a Profile |
The pairwise alignment below corresponds to the one obtained when the PDI_ASPNG sequence is searched with the THIOREDOXIN_2 profile. For the sake of the textual representation, the profile positions were symbolized by the residues of the "consensus" sequence of the multiple sequence alignment from which the profile was derived. This alignment is not fundamentally different from the one considered before
consensus   1 XVXVLSDENFDEXVXDSDKPVLVDFYAPWCGHCRALAPVFEELAEEYK----DBVKFVKV  -48
               : :         : : :  ::  : : ::::: : :    : :  :        :
PDI_ASPNG 360 PVTVVVAHSYKDLVIDNDKDVLLEFYAPWCGHCKALAPKYDELAALYAdhpdLAAKVTIA  -97

consensus  57 DVDENXELAEEYGVRGFPTIMFF--KBGEXVERYSGARBKEDLXEFIEK             -1
                :            : ::              : : :  : :  :
PDI_ASPNG 420 KID-ATANDVPDPITGFPTLRLYpaGAKDSPIEYSGSRTVEDLANFVKE             -49
|
but the textual representation does not reveal the additional information carried on by the profile scoring system, that eventually makes the identification by the profile so "informative". The alternative graphical representation of this alignment reveals much of this extra information.
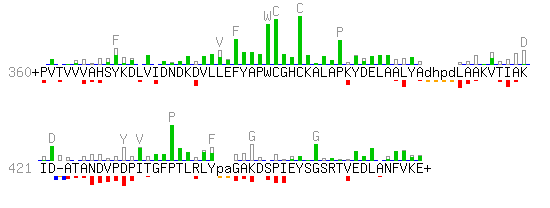
- In strong contrast to the previous example, the scoring system is heavily position-dependent: The area of every red rectangle corresponds to the score attributed by the profile for the presence of a particular residue at a particular position. The underlying gray rectangle represents the maximal score possible at that position. The amino acids of the profile consensus that might contribute the most to the profile score are represented in gray at the top of the background histogram.
- Three gaps are presented in this example. They score differently as the system of gap penalties is also position dependent in a profile.
- Two cysteines are found among the highest scoring residues of the above example. Actually they form the active site of thioredoxins. A proline residue, which is quite distant on the sequence, also rewards a particularly high score. Actually, this proline is spatially located close to the active site as shown on the figure below. Obviously, this is a case where the alignment of a sequence on a profile can provides indication for the possible function of selected residues.
|
Pagni M, Ioannidis V, Cerutti L, Zahn-Zabal M, Jongeneel CV, Hau J, Martin O, Kuznetsov D, Falquet L.
MyHits: improvements to an interactive resource for analyzing protein sequences.
Nucleic Acids Res. 2007 Jul;
35(Web Server issue):W433-7. [
RIS]